Sunday, 11 August 2013

Let The Trend Be Your Friend


Let The Trend Be Your Friend

I have long argued that the rally in equity markets we have witnessed since the lows of 2008/9 is a cyclical bull market recovery within the context of a much larger and longer secular bear market. Meaning that although these cyclical bull rallies can be extremely powerful and rewarding for those along for the ride,when the rally ends they will once again roll over and head south as a cyclical bear market takes over. 

 This procession of cyclical bull followed by cyclical bear and back again forms a huge, long-term trading range where equities go virtually nowhere. This is illustrated in the chart below, showing the movement of the US S&P500 index throughout its previous secular bear market period and comparing it to today's (this chart is a bit 'busy' but the point to note is the sequence of large rallies followed by collapses during the 66 to 82 timeframe, denoted in red), and although this is only comparing the current and previous secular bear market periods, the same 'pattern' exists in all secular bears to a large extent.


However, although the markets may be meandering their way to nowhere, one very important thing is changing, and that is valuations. 

By definition, the end of a secular bull market is signified by extremely low dividend yields and extremely high valuations, these having occured as investors caught up in the euphoria have bought shares in search of capital gains, driving prices and valuations up and the corresponding yields down until they get to extremes. Although company dividends generally increase over time, prices have simply been pushed up faster than the capacity for earnings to keep pace.
It is at this point that markets roll over into both a short term cyclical bear that will take prices down, and a long term secular bear that will ultimately return valuations to 'cheap'.
This long term rollercoaster of cyclical bull to bear and back is what buys the time for earnings to catch up.

At the end of these secular bear markets, the combination of increased earnings and reduced prices make valuations 'cheap' once again, and the stage is set for a new secular bull market to take place. 
It was the absence of valuations at anything like 'cheap' levels at the 2008/9 lows that strongly suggests that the secular bear market  is ongoing and that what we are witnessing is a continuation, albeit a long one, of the cyclical bull rally from those lows, NOT an entirely new secular bull market.

Now whilst this sets the background picture, it does not helps us with trying to predict when this rally will end and be replaced by the next cyclical bear market. I have talked in previous posts about the nature of tops being a process not an event, and that it takes time for the rally to 'run out of steam' as sellers slowly overpower buyers, this often being reflected in a dome shaped appearance.


 I have also talked about the CBOE S&P 100 Volatility Index and its use as a contrarian guide to investor complacency as to the risk of a market collapse. The process being that the more the market rallies, the more bullish investors become and the less they desire downside protection in the form of 'put' options. This lack of demand for puts is reflected in the low levels of volatility, and at extremes can be a useful indicator of a pending sell-off in the markets.

There also a number of technical analysis indicators that are used to monitor the internal health of the market and the level of participation, but some of the most indepth statistical analysis has been done by Tim Woods of www.cyclesman.net.
Through Tim's research he has discovered that there are certain similarities that occur at almost all cyclical bull rally tops, including the low correlation of certain indices and the appearance of a large number of divergences between price and supporting technical indicators (these occur when price makes a new high or low, but the indicator does not, thereby failing to confirm the price move).

 According to his analysis, the pieces are not yet in place for the cyclical bear market to begin, and this along with my own analysis and the appearance of a large and growing trend in the US dollar means I am apt to agree.

Since the tribulations that started to occur in the Euro zone last year, money has been gradually flowing towards the US via the US dollar. This trickle was given a boost with the Cyprus 'bail-in' plan that made it clear to investors that their bank deposits were not safe, and become more sustained once Japan declared war by QE on its own currency in the name of rescueing its economy. These events have acted as a catalyst in driving money to the safest of havens, the US. 

It seems ironic that with all the issues that currently entangle it, and the attrocious state of its finances, the US can still be considered a safe haven, however in the land of the blind the one-eyed man is king, and the US will continue to benefit from this increasing flow of funds into the US dollar as the problems in both Japan and the Euro zone worsen over the next couple of years.

This promises to have major repercussions on financial markets as this flow of funds will have two main effects, firstly driving the US dollar substantially higher, and secondly act as a major support for US equities as these funds are put to work. This really could be the dominant theme over the next couple of years and could overpower everything else, driving  US equities much higher in spite of their being overextended already.
 
Now whilst I do not now believe we are currently close to the top, I do think we are close to a top. US equities do seem ready for a correction  which has the potential to take them down between 7-10%, but in the light of what I have just said, the difference now is that at that point there is the potential for getting into the market to take advantage of the rally that will take it to new highs.

Once this rally takes hold we will have to monitor it for signs that the end is near, because this could become the longest cyclical bull rally in history, and one other point that Tim Woods has discovered is that the longer and farther the rally continues, the more painful the resultant cyclical bear.

 To help with clarity here is a loose chronology of what I think will occur:
  • Equity market correction taking markets down 10% ish, possibly caused by Fed comments re QE tapering or Euro stress over the upcoming German elections.
  • Correction ends to be replaced with another rally driven by increasing flow of funds into US dollar.
  • Rally takes equities to new highs as money flow becomes a flood, driven by collapsing Euro zone and Japanese Yen, this inspite of equities being over-extended by most benchmarks.
  •  Soaring US dollar and collapsing Euro, Japanese Yen and many sovereign debt markets.
  • Rally ends as the US becomes the last man standing, and the perception of it as a safe haven evaporates.
  • Equity markets collapse in a cyclical bear market, taking equities down to 'cheap' valuations once again.
It promises to be a very wild ride in financial markets over the next couple of years, as the number and complexity of macro themes is unprecedented, the benign period of the 80's,90's and early 2000's is well and truly behind us.


Thursday, 27 June 2013

NZ House Price Boom Rekindled

NZ House Price Boom Rekindled

After a couple of years of idling, NZ house prices are once again moving into top gear with REINZ's data showing the median New Zealand house price sale was $400,000 in March compared with $370,000 in March 2012, an annual increase of 8.1 per cent, whilst Auckland's median house price increased by 13.5 per cent, from $495,200 to $562,000 over the same period. These sorts of increase are a worry for both the Government and the Reserve Bank and are exactly what they were hoping to avoid, unfortunately they have both been long on talk and short on action, and without fundamental reform to address supply and demand side issues, this is one problem that will not go away.

I discussed the overvalued state of the housing market back in October 2012, in my post ‘ The New Zealand Property Market - The Bubble that Never Bursts', in it I outlined a number of the current problems, a few possible solutions and also illustrated that despite public perception, house prices can and do go down. However I also said that it would probably need the next global financial crisis to trigger the correction, because waiting for governments and central banks to do the job would likely be a long and painful experience. They are much better at talking a good game than implementing it, especially when it directly affects many of their supporters. For those of you that would like to catch up on that post you can find it here http://kiwiblackers.blogspot.co.nz/2012_10_01_archive.html


So let’s have a look at some of the issues currently affecting the housing market and see what we can discover.


1. Is this rally only a NZ phenomenon? 


No, a number of other countries are experience an uplift in their property markets, among them the US and the UK, however there are many other countries that are still seeing static or falling prices. It really is a very mixed bag seemingly dependent upon the economic situation in the respective country. But one very important point to note is that the countries that are now having the rally, also had the correction from the 2007 peaks, with both the US and the UK property markets falling by around 30% from their peak in real terms, once again making them attractive in valuation terms. By contrast, the most that NZ experienced was a 15% correction in real terms, nothing like the fall necessary to make them ‘cheap' once again. 


2. We already know about land supply constraint, the lack of houses being built and the cost of construction but is there anything else driving the rally?


  •   Persistent low interest rates are having multiple effects:


    It conditions borrowers to cheap credit and skews their perception of the risk and probability of interest rate rises, so encouraging them to take on debt.


    It forces investors to seek out yield in riskier assets because they cannot earn enough from deposits, so boosting speculative investing in housing.


    By allowing those with a mortgage to continue to service their debt at artificially low interest rates rather than having to sell the asset, supply is taken out of the market and the correction process is delayed, this creates pent-up demand from first time buyers and forces them to over leverage. 


  • Consumer confidence is at its highest since the 2008 GFC, and when people feel confident they spend money, and the more confident they feel the more likely they are to spend on big ticket items, and items don’t get much bigger than housing. (A side note is that consumer confidence can be used as a contrarian indicator, it is often at its peak just before the economy rolls over, and at its low just before the recovery begins). 

  • Little to no changes in tax policy towards housing as an investment asset means that investors continue to see housing as the best game in town and are now re-entering the market, and as such will continue to compete with those trying to buy a home rather than an asset.


     And probably the most important aspect:

  • In Auckland where the problems are most acute, there is clear evidence of extensive foreign buying of property. There are numerous stories of developers being outbid by mainly Asian investors for development land, with some people speculating that this is being used as a ticket into NZ because owning real estate increases immigration visa points. There are also many stories regarding young Asians able to buy properties by accessing large deposits out of Asia.


It is the combination of many factors over a considerable time period that has allowed the distortions in the housing market to develop, but it is the inflow of funds from offshore that are likely to really exacerbate the problem. The arguments that the critics of Asian buying are being racist, and that because this buying only makes up a small % of the total number of housing transactions it is not a problem, are completely missing the point.

 It is irrelevant whether the buying is from Asia, the US or Europe,the problem is not who is buying, but that the money is coming from an external source that is completely disconnected from the local market, which allows prices to be driven far above the levels that fundamentals are able to justify. It is also important to note that the price of any asset is set at the margin, which means that it is the buyer that pays the highest price for an asset that sets the price, it doesn't matter how far adrift the other potential buyers are, you only ever need one buyer to drive up the price. 


As an example consider a row of 20 identical houses in a street that are valued at $300000 each, there is only one house currently for sale and 2 buyers, one a local hoping to buy it for $300000, but able to pay up to $325000, and one from out of town that needs to buy a house that week and can pay whatever it takes. Unsurprisingly, the bidding is won by our 'out of towner' for $350000 and the effect is that all the other owners now have an expectation that their home is worth $350000 and will not sell for any less, forcing the buyers to pay the new asking price ($50000 above fair value) if they want to get into the market.  


In this example we see the effect that a solitary buyer has on price and perception, it should also then be clear that when that external buying is prolonged, major distortions will occur, and the greater the gap between price and fundamentals the more painful the correction when it happens.


So now we know what is driving the rally, how long is it likely to last?


The flippant answer is as long as there is fuel to drive it, meaning low interest rates, an ongoing flow of external capital and a lack of structural reform.  


Of these three, the least likely to occur is meaningful reform of all aspects of the housing market, the chances of a government led, co-ordinated overhaul of all the problem areas anytime in the near future are virtually nil.


Over the last couple of weeks global interest rates have risen as markets start to discount the reduction in direct US stimulus as recently indicated by the US Federal Reserve, and markets will remain vulnerable to any comments from the Fed about its $US85 billion in monthly bond purchases, which have driven bond prices up, kept interest rates at historic lows and helped drive the stock market's rally the last four years.


This is likely the start of what will be a long road to much higher interest rates as a new bear market develops in the Sovereign Debt market, and this will put severe strain on the housing market as debt servicing costs soar. You may like to review a previous post on the future for interest rates at http://kiwiblackers.blogspot.co.nz/2012_08_01_archive.html


Lastly, and the most difficult to predict is when the flow of overseas funding runs out. My best guess is that this will coincide with the next down-leg of the ongoing GFC, as this time it will likely impact Asia, Australia and therefore NZ to a far greater extent than in 2008, and I would expect to see global economies start to roll over within an 18 month timeframe.


To conclude, in spite of the ongoing over-valuation of NZ property, the conditions are currently ripe for further gains in the short to medium term, however it is crucial to understand that prices have disconnected from fundamentals and it is predominantly the combination of an ongoing supply of foreign money and cheap domestic credit that is levitating it. 


Once these drivers come to an end (and they always do!) it will be a long way down. Anyone choosing to invest now, especially in the Auckland area is buying into the 'greater fool' theory, namely they are relying on some greater fool to buy it off them at some point in the future!


Sunday, 12 May 2013

A Dead Cat Bounce

A Dead Cat Bounce

  
The precious metals sector certainly got more interesting last month when the levels of long term support were broken in dramatic fashion, something I had spoken about in my March post (http://kiwiblackers.blogspot.co.nz/2013_03_01_archive.html) entitled ‘Gold revisited’. In it I said there was a danger of a co-ordinated attack by the ‘professionals’ on both the gold and silver price, and we certainly got it!

  In a classic move starting on Friday the 12th April, gold was sold down aggressively closing the day at $1475, well below the $1530 support zone. Fridays are always the preferred day to initiate the move because it gets maximum coverage in the weekend press and builds up the selling pressure for the Monday morning opening, and by the close of business on the Tuesday gold had fallen as low as $1321. Silver had moved in tandem with gold as per usual and suffered a similar fate, falling over 20% in just three days and hitting a low of $22, pretty painful moves for those investors caught ‘long and wrong’.

  Since that selling stampede both precious metals have staged a rally, albeit an insipid one, with the buying coming from some investors looking for a quick bargain and others buying back their ‘short’ positions established at higher prices.

  So have prices already hit bottom and is this the start of a prolonged bull run?

  The answer is, I very much doubt it.

  There are a number of things that suggest we have unfinished business on the downside: 


  •  At a genuine low we should expect the rebound to be strong with good volume as buyers return to the market and chase the price higher. Whilst this could still occur, thus far the recovery off the lows has been relatively weak with low volume.
  • As was discussed in 'Gold Revisited' the move through the long-term support level in gold has triggered a downside price objective of $1070 and whilst this might not eventuate, it is far from a positive development.
  • On a price move as violent as we witnessed I would have expected the 'commercials' to have aggressively covered their short positions, but the latest COT data below shows that although they have bought back some of their 'shorts' it has hardly been dramatic, suggesting to me that they expect another bite at that cherry.   
  •  Lastly, we are entering the weakest period of the year for precious metals. Traditionally gold prices enjoy three bullish periods within the calender year driven by demand for physical gold, the first of which is the buying induced by the Chinese New Year celebrations around January/February. The second period is around August/September when Asian farmers harvest their crops and invest the profits into physical gold, and lastly the Indian marriage season that lasts from September through to November which creates the biggest demand spike of all, as gold is a hugely important part of most Indian wedding ceremonies in its form as a dowry. This May to July timeframe is absent of any drivers of physical demand so we often witness weakness in the precious metals during this period.
Although the evidence points to more weakness ahead, the rally may well continue a while longer yet before it runs out of steam. When big moves like this occur, price often retraces a part of the fall, sometimes even retracing the entire move and getting back to the point where the collapse began. However, having been 'underwater' on their investment and then seeing the price approaching their breakeven level, the temptation to sell is great and many investors will leave orders in the market to try to sell at these prices. This has the effect of changing what was for so long a level of support, into a level of resistance and becomes hard to break through, the buyers ultimately are outweighed by the volumes on offer and the price starts to fall again.
 It is this tendency for anything falling hard enough to bounce once it hits the ground that spawned the term 'dead cat bounce'.


The key will be what happens when the price once again approaches the low $1300 level, if it holds we may see a more meaningful rally develop from there, albeit with the risk of another serious collapse a bit later on, but if it fails it opens up the $1070 target again.

I would much prefer to see the price collapse down to these lower levels, forcing out the last of the sellers and turning investor sentiment very bearish. This would make the investment decision very easy by creating a major bottom and setting the scene for a multi-year rally that should take it through the all-time highs.

For now we watch and wait

Thursday, 4 April 2013

Pandora's Box: The Cyprus Story


Pandora’s Box: The Cyprus Story

Well here we are again, with yet another European country in financial distress and the ‘troika’ (European Commission, ECB, and the IMF) riding to the rescue. After a brief hiatus the ‘bailout bandwagon’ gets back on the road, and this time it’s Cyprus’s turn to go cap in hand to prevent it defaulting.
So how did Cyprus, a tiny country best known as a fantastic holiday destination, become the centre of a financial firestorm with far-reaching implications?

Its fate was effectively sealed when it joined the euro in 2008. Although it wasn’t in great financial shape at the time of joining, the imbalances in its financial system ballooned once it was effectively backed by the Euro rather than the Cypriot pound.

Over the five year period since joining, its bank assets have doubled, reaching an incredible eight times GDP and completely skewing the risk profile of the country. Money flooded in (much of it from the Russian mafia) attracted by low taxes, a relaxed attitude to banking regulations and the implied guarantee of euro membership. As a result of this flood of money, Cyprus became a major centre for tax evasion and money laundering. Awash in money, much of it ended up invested in Greek corporate and government debt, and when the Greeks effectively defaulted, this money went up in smoke and a Cypriot default became inevitable.

Now we know how the situation developed, let’s look at how the rescue deal was struck and why its ripples will spread much further than the Mediterranean.

 The original deal from the troika was to lend 10bn euros on the proviso that the Cypriots find the remaining 5.8bn euros by imposing a levy on bank deposits, part of which entailed depositors with 100,000 euros or less taking a 6.75% haircut.

Seeing that this would affect almost every voter in the country, create a huge political storm, and probably result in them being thrown out of office, the politicians did exactly what we would expect them to do, voted in their own self-interest and refused the deal.

After much wailing and gnashing of teeth a new proposal was made, ring-fencing those deposits below 100,000 euros, but placing a higher burden on wealthier depositors, and being the only politically tenable solution, was accepted.

Over this period the entire banking system was shutdown to prevent a mass flight of capital, although it is now becoming clear that certain overseas branches of the Cypriot banks remained open for withdrawals and that large sums were indeed spirited out of reach of the Cypriot authorities.
 It would be very interesting to discover who those people were that made these withdrawals, I would place a small wager that it includes politicians and high ranking government officials but I’m just an old cynic.

The net result of this is that it is still unclear as to the amount of haircut these large depositors will have to take, with some of the latest estimates as high as 80%.

So with peoples’ assets being taken, businesses going bust (1 in 3 has already gone bust) and an inability to get your assets out of the country due to capital controls, it is not hard to see the potential for civil unrest.

It is clear to see from all this that life for Cypriots is tough and will get a whole lot tougher in the months ahead. But however tragic for those caught up in the mess why does it have wider implications? 

The answer to that lies in the initial plan proposed by the troika.

The big question every depositor must ask themselves is ‘How safe is my money?’ and the answer (for deposits within the euro zone) was pretty safe, because the Eurozone Banking Deposit Guarantee Scheme provided protection up to a value of 100,000 euros.
However, the initial scheme proposed by the troika included a levy on all depositors irrespective of the amount deposited. The fact it was rejected is irrelevant, it still shows that the troika think that when needs must, peoples bank deposits are fair game. This undermines the very basis of confidence in the euro-zone banking system and changes the dynamic of where to hold your investments.

The significance of the troika’s initial proposal was reinforced by the comments from the man that brokered the deal, Eurogroup chief Jeroen Dijsselbloem who said that the Cypriot package is a template for future EMU rescues, with further haircuts for “uninsured deposit holders”. Once the effects of his comments sunk in, financial markets started to react, and in spite of a later ‘clarification’ of its meaning, the damage had been done.

The bottom line in all this is that the Euro project was flawed from the start. It was sold to the citizens of Europe as a financial amalgamation that would enable all the countries that participated to grow their economies and flourish, and although that certainly was a positive by-product, the main reason was to cement relationships between the major European countries (both financially and politically) so completely, that there would never again be another European war.

Unfortunately, because it was driven by politicians with an agenda rather than people that understand financial markets, major mistakes were made, including the decision not to amalgamate all the countries debts into one, creating a single Eurobond market.

These mistakes sowed the seed for the disaster that we now face.

Because it is still politically motivated, European authorities will continue on the same course, stating categorically that something won’t happen, until of course it does, forced to make harder and more unpalatable choices, as the process grinds on to its inevitable conclusion.


It is for this reason that we are seeing currency flows out of the euro and into the US dollar, a trickle that will become a flood as the euro crisis intensifies and big money starts looking for a safe haven.
 Small money can find a home in ‘tangibles’ like housing, land, antiques or gold, outside the financial system. But big money doesn’t have that luxury, and can only be parked within the system, making the ‘least worst’ the best option, and for the foreseeable future that will be US dollars.

However, in a few years time, when the US becomes the ‘last man standing’ it will face its own financial Armageddon.

The real tragedy in all this is that as a result of the design flaws in the original concept, and the troika’s rigid adherence to a political ideology, it will likely foster the exact sentiments that the entire Euro project was designed to eradicate, with harmonious relationships and a sense of unity, replaced by distrust, anger and a move towards nationalism.

I think this is a seminal moment in the history of the Euro zone.

Wednesday, 6 March 2013

GOLD REVISITED


GOLD REVISITED

In my first ever posting on this blog ‘To Buy or Not To Buy’, I said that gold and silver were undergoing a major correction in an ongoing bull market, and that although they were extremely oversold and a rally was imminent, once it had run its course we were likely to see even lower prices.

That was back in May 2012, and in the following few months we did indeed see rallies of 15% in gold and 20% in silver, however since those highs in September last year both metals have resumed their declines and are once again oversold and near some important levels of support.

So let’s have another look and see whether the time is right to dip our toes back into the water. 

If we start with a current chart of the gold price we can see the rally that developed from the May low and the subsequent decline. It is also clear to see the zone of support that has developed around the 1530 area, this area has provided a buying opportunity on three occasions and as a result has now become critically important.


It is a similar story with silver.

 
It is easy to see why some investors are starting to get exited, feeling that the correction has gone on for long enough, that sentiment in the sector is abysmal, that we are near to an area of major support and that therefore from a contrarian investing perspective the time is right. 

Normally I would be amongst them, however there are a couple of things nagging at me and one of them is the zone of support.

 As I mentioned earlier, this price zone has been reached three times, and each time there has been enough buying support to drive the gold price back up. The more the level works as support, the more confident investors get that it will continue to act as support, and as a consequence more of them buy gold when it gets around these levels. This works fine until the support fails, at that point many investors try to sell but because of the number of investors that are 'long gold' the price collapses leading to a stampede for the exit.

This can and does happen naturally, when normal sellers just overwhelm the number of buyers at a particular price. However it can also be engineered by some big players in the market that drive the price down through the support zone with heavy selling, creating a panic and a price collapse through the forced selling of investors long positions. 

Once the price collapses and volumes rise, these same players that triggered the collapse go onto the bid side and buy back their positions (going long), knowing that once the dust has settled, the price will go back up because all of the potential sellers have now been forced out.

This may come as a shock to many of you but it happens on a regular basis in financial markets all over the world, and is a tried and trusted technique. Many years ago in my days working for an Investment Bank I even used it myself, so can vouch for its effectiveness. ( It can be argued that these practises, along with many others should be made illegal and you'll hear no argument from me. But until they are, if you intend to play with the big boys it helps to understand how they operate!)


With this in mind let us now take a look at the latest Committment of Traders (COT) data for gold. You may recall I have used this predictive tool in previous posts as it gives some perspective on what positions both the commercials (professionals) and speculators ('Joe Blow' investor) currently holds.


On this chart we can see the build up of 'short' positions by the professionals around the price high in September last year and the buying back of these shorts as the gold price has fallen. However, whilst their short positions have come back to a more normal level there is still plenty of room for them to engineer a further price fall and buy back more. It is important to understand that even though they have reduced their positions, they are still short gold.

Lets also have a look at silver to see if it corroborates what we have seen in gold.


With silver we can also see the extreme short position held by the commercials, and that they have also reduced their positions as the price has fallen. However it is also clear that they still have some way to go and that further price falls would benefit them greatly.

Lastly I want to look at a seldom used type of chart called a Point & Figure chart. These are different from ordinary charts in that they do not measure price against time. Price rises are marked with Xs and price falls are marked with Os, and if the price is unchanged nothing happens to the chart irrespective of whether the price is the same for a day, a week or a month.

They are interesting because the nature of the chart allows forecasts to be made as to future price movements. I don't intend to go into a detailed expanation of P&F charting here, but from looking at the chart below we can see that there is already a downside target in gold of 1365 and that should the price close below the 1533 level, another downside count will be activated around the 1100 level.

Lets have a quick look at a P&F chart of GDX which is an index of a number of gold and silver producing companies. For the gold price targets to have validity they should be matched by similar targets in the mining companies themselves as its hard to envisage a much lower gold price without a corresponding fall in mining shares.


And indeed we can see there is a downside target already triggered of 23.49 which would be a fall of over 30%.

It is very important to understand that these targets aren't set in stone, they can be reversed by price movements, and price can often fall short of the target. They are though an important tool in trying to fathom what a market will do and it is uncanny how accurate they can be.

So let's try to pull this all together.

 On the upside gold and silver are both very oversold, under-loved and near to important areas of support, and the COT figures in both have moderated considerably from their highs allowing a possible rally to form. The danger however is that the support gives way, and there certainly are signs that were that to occur it could turn very ugly for a period of time.

I think the downside risks are too great at the moment and would rather wait until the picture is clearer, either by the price once again bouncing off support and the COT picture continuing to improve, or by the price crashing through the support level and seeing massive selling. 

Either way I don't think we will have long to wait.

But be in no doubt,whenever it occurs the end of this correction will provide a great buying opportunity for the rally that will follow in the years ahead as the sovereign debt crisis explodes.

Friday, 25 January 2013

A New Year, a New Bull Market?


A New Year, a New Bull Market?


Many stock markets have started the year on a tear, with impressive gains seen in many indices, including the S&P 500 and the FTSE 100 both of which are already up over 4%.

There are a number of reasons for this enthusiasm including, a generally rosier view of the global economy, an increasing belief that global quantitative easing (QE) will float asset prices higher (triggered by the Bank of Japan’s [BOJ] recent statement that they intend to print money till their ears bleed, in a final attempt to kick-start their economy from its 20 year slump), and a continuing hiatus in the bad news flow emanating from the euro zone. But probably the most important reason
is the sense of relief triggered by the ‘resolution’ of the Fiscal Cliff issue.

Heading into the close of 2012 global investors were concerned about the rumbling Fiscal Cliff issue, and as a consequence went into ‘risk-off’ mode, meaning stocks and commodities were sold and the funds reinvested into safe havens like US Treasury bonds. Compounding this trend were the many pension funds, investment funds and hedge funds that have the 31st December as their financial year-end. 

Because the ‘bottom line’ of financial institutions dictates the level of bonus payments that will be made, these institutions tend to become more risk averse the nearer they get to their end of year date. The last thing they want is to ‘take a bath’ on the markets when there is little or no time to make the money back, so they become ‘gun shy’, hanging on to what they have already made rather than look for more opportunities.


This has two effects; firstly in periods when there is already a bigger issue undermining investors’ confidence and the markets are under selling pressure, this trend is accentuated. And secondly, as soon as the new financial year begins these same institutions look to redeploy these same funds back into the market as quickly as possible, leading to a flood of buying and higher prices.
Indeed, over the last few weeks we have seen some of the biggest flows in to equity funds since the 2007 peak.

It is the combination of this rush back into the markets by the financial institutions, and the sense of relief and optimism and return to ‘risk on’ triggered by the fiscal cliff deal that is fuelling the current rally.

So will it continue? Can we look forward to a positive year for stock markets, with an improving economy and an increased appetite for risk? Or is it just a short term fillip, soon to wear off?

Lipstick on a Pig

Although the last gasp fiscal cliff resolution inspired the confidence of investors, it was anything but a true resolution. In my last post http://kiwiblackers.blogspot.co.nz/2012/12/the-fiscal-cliff.html I explained what the fiscal cliff actually was and what I anticipated would happen, thinking that the most probable outcome would be some partial solution with the problem being shunted further into the future.
 
Unsurprisingly that is pretty much what happened, so in spite of the markets’ vote of confidence, the problems have not been dealt with or gone away, and have actually been made worse. But that is a problem for another day it would seem. 

 We will be hearing much more about both the fiscal cliff and the debt ceiling in the months ahead.

Back in the euro zone all has been quiet since the ECB’s announcement back in September 2012 that it would support struggling European countries by unlimited buying of their short term bonds (in order to keep interest rates down and allow them to service their debt) via its Outright Monetary Transactions (OMT), leading to a recovery in many European financial markets.

In the months following, attention focused on the US as it struggled with its own debt and solvency issues. However silence does not equal solution, and although the relative calm may lead us to believe that blue skies lay ahead for Europe, it is far more likely that they are actually in the eye of the hurricane.
 
The systemic and deep-rooted issues in Europe remain, and the OMT’s have done nothing to solve the issues, and indeed are not intended to. But these problems will force themselves to the forefront again once the ‘juice’ from the OMT’s starts to wear off.

So in spite of the increased confidence the background picture continues to decay, with nothing being done to actually resolve the underlying issues, but efforts focused instead on preventing the system imploding. 

Unfortunately all the makeup in the world can’t hide that unpleasant truth.

Priced to Perfection

As we have discussed in previous posts, markets oscillate around a mean, moving from overbought to oversold and back again, with extremes of sentiment taking place at both the major highs and the lows. 

At bottoms investors are very bearish, sick of falling prices and desperate to cut their losses. As they panic out of their positions, prices collapse leading to more panic until the market bottoms with a crescendo of selling, and at that point once everyone that wants to sell has sold and the worst that can happen has been discounted, only buyers remain and the next rally begins.

At tops it is the reverse, as prices move up investors become more bullish so more buying develops pushing prices even higher, this sucks in even more buyers, then as complacency rules, thoughts of a correction are far from investors minds and everyone that wants to buy has already bought, at this point all the good news is discounted, the market is ‘priced to perfection’ and the correction starts.

The difference is that a bottom is often an event, a few days when sellers collectively ‘throw in the towel’, and the rally that follows can be fast and hard creating a ‘V shaped’ bounce. Whereas a top is a process, a series of rallies and corrections sucking in ever more money and investors often taking weeks or months and having more of a ‘dome shaped’ appearance.

We can see this in the chart of the S&P 500 index below


It is the manner of this topping process that makes them much harder to identify than bottoms. However there is one useful tool that helps us to track investor sentiment, giving us a way to measure the level of complacency or fear that exists in the stock market.

The Fear Index

When funds and large investors want to lower their risk exposure to the stock market they can of course just sell some of their holdings, however this isn’t always possible and can sometimes be prohibitively expensive. Another cheaper solution is to ‘hedge’ your exposure, so that any money you lose on your underlying position is offset by the money made on your hedge position, giving the same net result as if you had just sold your underlying.
 
To achieve this hedge, investors will often buy ‘put options’ on the S&P 500 index. These options are derivative contracts that give the buyer the right (but not the obligation) to sell the index at an agreed price at some point in the future, they therefore go up in value when the index falls and decrease in price when the index rallies. 

Because you only buy the right to sell not the obligation, these options are cheap in relation to the level of protection they offer, so like an insurance policy they protect you when you need it and when you don’t they are just the price you pay for peace of mind.

It is therefore easy to see that during periods when investors are bullish and can see no risk to their portfolios, they do not feel the need to buy put options as a hedge and as a result these options trade quite cheaply. The converse is true when investors are bearish, fear is rife, and markets are falling. At these times the demand for put options explodes, as does the price.

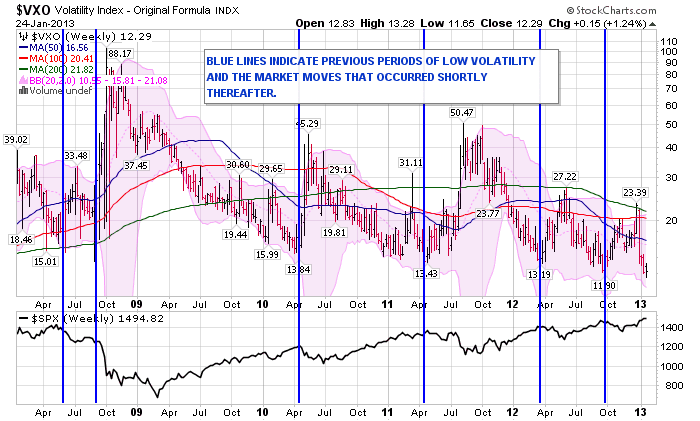
Fortunately for us, there is an index that tracks this relative pricing of put options known as the CBOE S&P 100 Volatility Index. It is important to note that there is more than one volatility index, and that the methodology used to calculate it is far more complex than I have described, but for our purposes if we visualise high readings as meaning fear and low readings as complacency, it will suffice.

On the chart below I have added the price of the S&P 500 index to the volatility chart. We can see that volatility is currently very low, and that on previous occasions when it was around this level a stock market correction wasn’t far away.


Conclusion

January is often a positive month for equities as money is ‘put to work’ in the markets, but this year that trend is being magnified by the fiscal cliff debacle. We know that the money flows into equities are the biggest they have been for many years, a sure sign that ‘Joe Blow’ investor is bullish, and this high level of complacency is substantiated by the very low levels of fear shown in the Volatility Index.
When we add this to the deteriorating background picture and the fact that many equity markets are close to heavy overhead resistance (as shown in the chart of the S&P500 Index below), it is hard to see a positive long term outlook, this is just not the recipe for a new bull market.


Having said all this, it is crucial to understand that in spite of the overextended state of the markets, there is nothing to stop them rallying a little further before the correction begins, as we have already seen these tops can take a frustratingly long time to complete, but this should be the last gasp of the cyclical bounce from the 2009 lows. 

We just need to be patient and wait for the markets themselves to tell us when the time is right, rather than trying to ‘jump the gun’; because as John Maynard Keynes famously said ‘The market can stay irrational longer than you can stay solvent’.

Saturday, 22 December 2012

The Fiscal Cliff


The Fiscal Cliff 

It’s hard to turn on the news at the moment without someone discussing the U.S Fiscal Cliff and the dire consequences of plunging over it. Will a solution be found in time? Will the Democrats and Republicans continue to lock horns or will sense prevail?

 Much of the coverage is the usual ill informed jawboning by the media looking to fill airtime at a traditionally quiet time of year, however this is an important issue and it is already having an impact on financial markets, so let’s take a closer look.

So what is the Fiscal Cliff?

The history of the Fiscal Cliff goes way back to President Reagan’s time in office. Together with the Congress, his administration and the many since have periodically imposed a time limit on themselves to force them to agree to unpalatable tax increases and spending cuts in order to reduce the country’s Federal Deficit.

 In a nutshell, the current inability to solve the issue is because the Republicans want additional cuts in spending rather than higher taxes for the ‘rich’, whilst President Obama and the Democrats want to cut spending less severely but recoup more in taxes from those earning over US$250000 a year. This is as much an ideological debate as anything else, which explains why they are having such a hard time finding a solution.

The last time this came to a head was in August of 2011 during the Debt Ceiling discussions , and in the best traditions of politicians never to solve anything today that can be put off till tomorrow, they kicked the can down the road until Dec 31st 2012. After which time, unless an agreement is found, automatic spending cuts and tax increases will be triggered to the tune of US$560 billion, reducing the deficit by roughly half.

 This would have a huge impact with estimates suggesting a loss of 2 million jobs and a 4% fall in GDP in 2013, leading to a severe recession.
Unfortunately there are now a couple of other complicating issues that were not anticipated when the date was set.

Firstly there is the expiration of the Bush tax cuts (tax cuts implemented by President Bush to boost the economy at the time, and subsequently continued by the Obama administration). The expiration of these cuts will act the same as a tax hike, and the fact that they are also scheduled at the same time will only compound the problem.

Secondly, at some point in the first quarter the U.S will once again run up against its Debt Ceiling.
 This is the maximum amount that the government can borrow at any given time, and was set back in August 2011 when both a backstop date of 31st Dec 2012 was agreed for the triggering of the ‘fiscal cliff’, and an increase of US$2.4 trillion was authorised for the debt ceiling bringing it up to the current level ofUS$16.4 trillion.

This 2011 debate brought the issue into the public eye for the first time, and was a bruising political slugfest, with a deal only being reached at the 11th hour, and now only sixteen months and US$2.4 trillion later here we are again.

Certainly the repercussions of not getting a deal done are extremely unpleasant. With one of the implications being that the U.S govt would no longer be able to issue more debt to raise funds, it would be unable to meet its financial obligations and the risk of default would increase dramatically.

 We can now see that whilst most people are simply focussed on a resolution to the fiscal cliff, there are a number of issues intertwined, making it a very complex high stakes game indeed. There is a lot to play for and a heck of a lot to lose.

So what do I think will happen?

Well I think there are three potential outcomes:

1.     The politicians on both sides could finally grasp the enormity of what the country faces and putting their ideological dogma to one side agree to a long term plan of eradicating the financial deficit and paying down the country’s debt.
I give this plan about the same chance as Santa coming down my chimney and leaving me the keys to a brand new Ferrari on Christmas Day.

2.     Either the Republicans or the Democrats can see some political advantage in driving the country over the cliff and potentially gaining a better deal once the tax hikes and spending cuts start to bite.
This is a hard one to read but I have absolutely no doubt that either side would do it if they felt they could obtain a clear advantage.

3.     Politicians do what they do best. Grandstand and talk tough long enough to gain approval with their own electorate, and then strike some half-baked deal that solves nothing, kicks the can even further down the road but allows both sides to walk away claiming victory.

Now, call me old fashioned but I know what my money is on.

Of course there is one way they could thrash out a deal very quickly. All they need do is cancel the Christmas holiday for congress, mandate 100% attendance and maintain the session until an agreement is reached. I am sure this would inspire a plague-like outbreak of commonsense and accord.

Unfortunately the likelihood is that politicians will do nothing meaningful until the crisis becomes so severe that the general populace rise up and demand change. At that point they will listen or be voted out, but the chance to solve the problems will have already been lost.

The problems the U.S faces are mammoth, but fortunately for it, there are other regions with more pressing problems. Having been an oasis of calm for a few months now, the Euro zone will burst back onto the scene in 2013 (followed closely by Japan) as the sovereign debt crisis really bites, leading to the U.S temporarily regaining its flight to quality ‘safe haven’ status until it is the last man standing.

It might help to visualise a fleet of ships all sinking at different rates, and as one slips below the waves the crew clamber in hope onto the next one, until that too slips below the waves so they clamber onto the next, and so on until they are on the final ship, and when that finally sinks there is nowhere to go.

That is the global economy, and that’s what awaits us unless we do something now.

I will try to do another post before year end and give an update on how the financial markets are faring, but just in case the call of the beach is too strong I wish you all a fantastic festive season wherever you may be and see you in 2013.