Wednesday, 22 June 2016

Brexit and the Future of Europe


Brexit and the Future of Europe

Over the last few weeks the news media has been awash with discussion and debate over the outcome of the upcoming UK vote on European membership – or ‘Brexit’. With the two sides fighting an increasingly hostile battle to convince voters ahead of the referendum scheduled for June 23rd.

On the one hand the Remain camp argues that leaving would be hugely damaging to the UK economy and leave it as a fringe player in European and Global politics. Conversely, the Leave camp counter that leaving would actually boost the British economy, restrict the number of illegal immigrants entering the country and enable it to self-govern, unfettered by European interference.

The debate has been long on rhetoric and short on substance and it took the tragic murder of the British pro Remain MP Jo Cox by a supposed Leave fanatic a few days ago to force a rethink by both sides, and take some of the bitterness out of the argument.

Unfortunately, whilst both sides have been busy shouting at each other, it has been increasingly hard for the voters to get any unbiased information in order to make an informed decision, with the ‘facts’ put out by one side, quickly refuted by the other.

 It is incredibly hard to quantify the ‘benefit’ that the UK has obtained from being in the EU. It will always be open to a large degree of interpretation and the truth will be in the eye of the beholder. The answer probably lies somewhere in the middle, not as bad as the ‘Leave’ camp claim, and not as good as the ‘Remain’ camp counter. But in reality, there really is no point in striving to answer that question. What’s done is done, and the most important questions now are What does the future of the European Union look like? And is Britain better off being a part of it?

I have spoken in previous posts about the outlook for the European Union. Back in April 2013 when Cyprus was generously ‘bailed out’ by the Troika (the European Commission, the ECB and the IMF) I wrote the following:

‘The bottom line in all this is that the Euro project was flawed from the start. It was sold to the citizens of Europe as a financial amalgamation that would enable all the countries that participated to grow their economies and flourish, and although that certainly was a positive by-product, the main reason was to cement relationships between the major European countries (both financially and politically) so completely, that there would never again be another European war.

Unfortunately, because it was driven by politicians with an agenda rather than people that understand financial markets, major mistakes were made, including the decision not to amalgamate all the countries debts into one, creating a single Eurobond market.

These mistakes sowed the seed for the disaster that we now face.

Because it is still politically motivated, European authorities will continue on the same course, stating categorically that something won’t happen, until of course it does, forced to make harder and more unpalatable choices, as the process grinds on to its inevitable conclusion.

The real tragedy in all this is that as a result of the design flaws in the original concept, and the troika’s rigid adherence to a political ideology, it will likely foster the exact sentiments that the entire Euro project was designed to eradicate, with harmonious relationships and a sense of unity, replaced by distrust, anger and a move towards nationalism.'

As the global economy has slowed and the European bloc fallen into recession, we have indeed seen these predictions come true, with rising civil unrest, increasing distrust of the political system and stronger nationalistic feelings manifesting in many countries, even those thought of as being at the core of Europe , France and Germany. These pressures will only increase as the process unfolds.

Whilst the fundamental picture is not good, it is always handy to see how the financial markets are assessing things. The long term health of a country can often be forecast by looking at the performance of its currency relative to others. The currency rate is driven by global money flows moving across the globe looking for relative advantage. For example, if global investors see the US prospects as looking bright relative to other countries, they will sell their domestic currency in exchange for US dollars in order to buy the US denominated assets they think will perform, be they Real Estate, Stocks or Bonds etc. As a result we see the US dollar rally in relation to other currencies, and the greater the perceived relative opportunity the greater the out-performance will be.

If we now look at a long term chart of the Euro, the picture is sobering. I have used this chart in previous posts but it doesn’t get any better the more you look at it. In it we can see the entire history of the Euro from its inception in 1999, falling to its low in 2000 followed by its rally through the boom years of the mid 2000’s to peak in 2008 with the GFC, before trading lower and collapsing through 2014. Since then it has been consolidating, but that is where the good news ends. The chart is indicating a bearish price objective of 71.32 and whilst there is no guarantee it will reach this level, P&F charts can be uncannily accurate in their predictions. Either way, this chart is very bearish and a close below 105.90 will open the euro up to a very big move.


The implications of this chart are huge. Were the euro to collapse as this chart is indicating it would be catastrophic for the Eurozone economies and have profound affects around the globe. Unfortunately, in my opinion this ties in with the fundamentals of how the Eurozone political powers have been operating. Their adherence to a political dogma blinds them to the repercussions of their actions. Whilst the people of Europe become less enamoured of the European project and more nationalistic, less trustful of their elected representatives and less tolerant of the systemic corruption within these entrenched political bodies. The political bodies themselves are taking an increasingly hard line on individuals or countries that refuse to fall in. The people and their elected representatives are taking different paths and it can only end in tears.

It seems that the future of the Eurozone is already set - there is pain on the horizon. Britain has a choice, it can remain tethered to the fortunes of the Eurozone come what may, or it can take its chances on its own. Whilst that may not be anyones idea of a utopia, it is a damn sight better than the alternative.

I know what I would do

Tuesday, 1 September 2015

A Brief Pause or the End for Equities?


 A Brief Pause or the End for Equities?

All financial assets move in long wave cycles from undervalued to overvalued and back again, but whilst the duration of these cycles varies across these asset groups, irrespective of whether it is commodities, equities , bonds or real estate, they all move in a similar way. During the movement from undervalued to overvalues, prices rise in a long term 'bull market', punctuated by severe corrections or counter-trend moves along the way. Once the over valuation has reached an extreme, the market reverses, and enters a 'bear market' where prices once again start their long descent.

We can see this illustrated in the chart below.


 During the 'bull market' phase, as prices rise and the fear of the preceding 'bear market' is forgotten, investors emotions slowly move from depression through hope, optimism and exitement  to reach their final state of euphoria and greed.

However, whilst this journey might seem simple, due to these counter-trend moves the reality is very different. Whenever investors become too bullish, too confident and too convinced that a trend is in place, a correction will take place that will shake their beliefs and re-introduce a touch of fear into their lives, Is the bull market over? Will prices continue to fall? The bull market will shake some investors off its back and then continue onwards and upwards until investors once again get too bullish. This is why it is so important to monitor things like the Committment of Traders (COT) reports, as they can give great insight into the level of bullishness in a market give indications as to when a counter-trend move might begin.

We can see how these counter-trend moves have impacted the S&P 500 Index since the start of the current cyclical bull market in 2009.


These corrections are normally fast and furious, exactly the kind of conditions needed to inspire fear amongst investors, and during the month of August we have seen counter-trend moves in a number of markets, among them Equity markets, the US dollar and Gold. In the next chart of the S&P 500 Index I have extended the data to include the entire move since the 2009 lows and we can see how long it has been since a serious correction took hold, it was clearly long overdue.


Because of the severity of the latest correction, especially last weeks volatility, investors have once again begun to question whether the bull market is over. The answer is possibly, but I doubt it. Bull markets finish when the public get sucked in due to the constantly rising prices. This stampede of investors leads to spectacular price rises and a 'blow-off' phase, typified by 'this time is different' thinking and to coin a phrase from Alan Greenspan, 'irrational exuberance' (see chart below). Thus far we have not witnessed this, and allied to my belief that as the global economy unfolds money will flow into US Equities as a safe haven leads me to believe that equities will recover and go to new highs.

However, just because the market should rally to new highs doesn't mean it can't have a bigger correction now. If we look at the Point & Figure chart of the S&P Index below we can see that the rally from last weeks low at 1870 has paused at overhead resistance in the 1990 area. 


 The market is now at a critical juncture where either the panic will subside and prices will continue to grind higher, or the market will roll over again and test the lows. Should the sell-off resume, the 1870 low will provide the first point of support, followed by 1830 and 1740. It is also worth noting the bearish price objective of 1621, and although price counts tend to be more accurate when they occur in the direction of the major trend (which in the case of the S&P is up) we should not just disregard it.

  Having waited so long for a correction to materialize, it is unlikely to be over so soon, and the probability is that there is more volatility ahead. Should we retest the lows and go lower, keep your eyes on the support levels and the 'talking heads' on TV. 

When they start saying that the bull market is over, it's time to buy!


Tuesday, 19 May 2015

The Greek Euro Death Roll


The Greek Euro Death Roll

Like a poor story line from a soap opera, the Greek euro saga seems to have been playing out for years. On a number of occasions the warning signals have flashed amongst talk of imminent defaults, Greek economic collapse and the resultant chaos in the Eurozone, only for some political agreement to be cobbled together and the endgame kicked further down the road.

The crisis started for Greece back in 2009, badly affected by the fallout from the GFC, Greece struggled to pay back its sizeable debts. Concerned by the possibility of a Greek default, international investors stopped buying any more government debt, cutting off the usual funding stream and forcing the government to borrow yet more money from the EU and the IMF. This borrowing in turn also needed repaying with interest, and as the repayment dates loomed more borrowing was needed to fund the repayments from these previous loans, the downward spiral was set and Greece and the Eurozone became locked in a financial death roll. 

Over the years since 2009 the effects on the Greek people have been profound. Part of the terms of the initial bailout was that Greece implement a policy of severe austerity in order to get their borrowing under control. This has resulted in economic hardship, civil unrest and political turmoil as successive governments have been caught between the demands of the eurozone on one hand and the people's resistance to austerity on the other. It must be remembered of course that the Greeks have hardly been innocents in their own demise, with decades of rampant corruption, endemic tax evasion and financial mismanagement laying the foundations of disaster long ago, however it is the actions of the European Union and the IMF, more interested in their own preservation than in the welbeing of Greece that has compounded the problem.

The EU is determined to keep Greece inside the monetary union. It cannot allow the Greeks to default on its debts whatever the cost to the Greek people, as a Greek default would open the door for Portugal, Spain, Italy and a host of other countries to renege on their debts and the entire Euro experiment would die. However in spite of using increasingly large carrots and sticks in order to force the Greeks into compliance, the Greek people are becoming increasingly vocal in their opposition to the restrictions imposed upon them, and it is my belief that if not the current government,ultimately they will elect a government that will take them out of Europe whatever the cost. 

One of the ways we can see how the financial markets interpret the risks to the eurozone from a Greek default is through the currency. As a general rule, the more confidence international investors have in a country or economic zone, the more money they will move into that currency in order to invest in its bonds, equities, property etc. Conversely, as confidence wanes, these assets are sold and the money is then moved out of the currency into something with a better return, like US Dollars for example. The movement of the currency acts as a barometer, enabling us to interpret what the future might hold.

Here we can see a chart of the Euro relative to the US Dollar.


It shows us the high in the Euro prior to the GFC and the subsequent multi year trading range ending with a break below the 119/120 support in December of last year. Subsequently it dropped like a brick until finding some support in March, since when it has managed to stage a recovery. We can see from the oversold readings on the RSI indicator at the bottom of the chart that the price collapse from the 139 level was extreme and that a rally was overdue, however longer term the price move has done serious damage to the outlook for the Euro, something we can better see with the next chart.

Here we have a Long Term Point & Figure Chart of the Euro.

I have talked in previous posts about the predictive powers of a P&F chart and that whilst it isn't infallible, it can be incredibly accurate. Here we see the entire history of the Euro currency and it is clear that the breaching of the 119 level has triggered a downside count of 71.32. This is an incredible target and suggests a virtual implosion of the eurozone in its current form.

We know that since March the Euro has rallied from very oversold conditions and the next chart gives us a shorter term perspective to help gauge how much longer the rally might continue.

Here we have a shorter term P&F Chart of the Euro showing that the rally target of 113.24 from the March low has already been met, and that there is likely to be resistance around the 115 level. We also know that should 115 be broken and the rally continue, the old support level of 119/120 would provide serious overhead resistance.

When we look at these charts collectively they seem to indicate that whilst there is the potential for a further Euro rally in the short term, the medium to long term outlook is extremely negative. Although the downside count of 71.32 is extreme, when we consider the cascading effect from a Greek debt default it is not hard to imagine such a scenario and the implications of such a move would indeed be catastrophic for many people and businesses, it might well pay to consider what alternatives you might have should you be holding Euro denominated assets.

It must be stressed that the move is highly unlikely to occur in a straight line, there will be falls and rallies however the potential for a panic move cannot be ruled out, especially when the Greek domino finally falls.

Whenever Greece ultimately defaults it will lead to years of economic hardship for its citizens, however it is what it portends for the rest of Europe that is really worrying

Monday, 15 December 2014

Oil: How low can she go?


Oil: How low can she go?


 Oil has been taking an absolute hammering over the last few months, falling from around $110usd a barrel in July to below $60usd currently. This correction has been caused by a combination of factors including an undermining of the traditional oil business dynamic by the explosion in US Shale Oil development, a general lack of demand for oil due to a slowing global economy, with demand according to the Organization for Economic Co-operation and Develoment (OECD) currently at 15 year lows. High levels of stockpiled oil around the globe, and lastly, liquidation of speculative long positions on oil by investors who thought the price would rally and have been caught long and wrong.

The bad news for the oil market is that the first three of the factors mentioned are likely to persist for some time yet, and certainly in the case of oil demand I would expect it to fall substantially from here as the next leg of the GFC starts to bite and undermines the global economy still further. In the case of the speculative liquidation we can see how this is developing by using the Committment of Traders Data (COT) that is published weekly by the US Commodity Futures Trading Commision (CFTC). This data covers a whole range of markets and breaks the ownership of futures and options in each particular market into three categories, commercials, large speculators and small speculators. We have used these charts previously as they can offer great insight into where a market might be heading because of the tendency for commercials to consistently get it right, and for the speculators to consistently get it wrong!

Here we can see the current COT data for crude oil.


We can see the extreme short position by the commercials in July of this year when oil peaked (signified by the red bars), and the fact that they have bought back those shorts and reduced their positions as the speculators have sold out. However, they still hold a sizable short position even after the price falls we have seen, and the general picture is not compelling that a sustainable bottom has been reached. I would expect to see the commercials close out all of their shorts and possibly even go long before the true bottom is found.

Because of oil's pivotal role in todays society, being used in everything from pharmaceuticals to fertilizer and plastics to clothing, as well as its obvious role as a transport fuel, this drop in price has been welcome news with the price falls acting as a tax cut and boosting the cash in our pocket in a very direct way. According to Bank of America this windfall may be the equivalent of $1 trillion worth of stimulus, no small sum! Unfortunately, the benefits aren't distributed equally, with the stresses found in many of the current oil exporting countries, many of which are either experiencing civil unrest like the countries of the middle east, or are becoming increasingly aggressive in their dealings with their neighbours, like Russia. Most of these countries are entirely reliant upon oil revenues to keep their economies operating, and with oil at $58 many of those countries are financially underwater. This rising tide of unrest, either internal or external, allied to a severe constriction in revenues moving forward does not bode well. During most of the oil price correction many equity markets have rallied, enjoying this oil-based tailwind, but as the fall has became a rout, these fears over the resulting macro issues have grown and overwhelmed the earlier exuberance. The fall in equities  over the last few days has directly stemmed from the unresolved question - how low can oil go?

So with a view to answering that question, lets have a look at the current chart of crude oil.


We can see that oil is close to a previous line of support around the mid 50's, we can also see how extremely oversold it is on both RSI and Stochastics, levels last seen at the  lows of the GFC. Should those levels give way, the next major support is the 2008 low of $37.57, and should that fail, hang onto your hat!

Whilst these charts give us some idea of levels where support might be found, and how oversold oil currently is, they are no use for giving us a potential target price. 

For that we have to turn to point and figure charts.

Here is a long term chart of Light Sweet Crude, a particular type of crude oil that is predominant in the US. When I first saw this chart I amost fell over as it is showing a downside count or target of $8.95, which seems incredible. I therefore ran multiple P&F charts over different scales and durations and a figure around $8 to $9 appeared a number of times. This is concerning on a number of levels, the fact that the targets appear on multiple charts  gives it more substance, but most importantly, if we actually reach $9 it means that all hell has broken loose in terms of the global economy.

Before we get too carried away, I have to say that P&F charts are not infallible, circumstances can change, targets can be cancelled out and prices can just fail to reach the target. But they can also be incredibly accurate and provide information that no other type of chart can provide. 

Whilst the $9 downside target certainly came as a shock I can certainly foresee the reasons why it might happen. Apart from the systemic problems outlined at the start, there is also the issue of a rapidly appreciating US dollar which will continue to exert downward pressure on all commodities, including oil. This, allied to the pending collapse in sovereign debt markets and a deflating global economy are more than enough ammunition to drive oil much lower. You should also not be surprised to hear that commodity prices are themselves cyclical and we are currently in the down phase of that particular cycle.

We at least now have an understanding of what might happen, the key will be the support levels. If the mid 50's can hold and a concerted rally occur there is a chance that the technical damage can be undone. My gut feeling is that oil will go much lower, though not necessarily in a straight line and not necessarily now. 

Have a wonderful Christmas and a Happy New Year, see you in 2015


Monday, 13 October 2014

Correction Time - Its Finally Arrived


Correction Time – It’s Finally Arrived


Back in May I wrote a post called 'Seasonality and the Stock Market'
http://kiwiblackers.blogspot.co.nz/2014/05/seasonality-and-stock-market.html
which explained that statistically, stock markets are weakest during the May to September timeframe. I also discussed that although the markets were still rising, they were losing momentum and that because the rally had gone on for so long without a major correction, there was a good chance of one developing over the next few months.


The US equity markets rallied for another couple of months until succumbing to a short, sharp correction in July. Whilst this made investors nervous, the 4% correction was nowhere near enough to bleed off excessive investor optimism, and they returned to the markets driving them to new all time highs in September. However throughout this period the internal dynamics of the markets had continued to deteriorate, with fewer and fewer stocks participating in the rally, and many technical indicators flashing warning signs. The markets may have been at all time highs, but they were on very thin ice.

Whilst the equity markets have powered ahead, a number of storm clouds have gathered. In Europe, the same old problems are rearing their head with many of the economies in recession and the entire eurozone in danger of falling into outright deflation due to the ineffectual financial management of the European Central Bank (ECB). This fear of deflation is leading to speculation that the ECB will have no choice but to launch a massive wave of quantitative easing (QE) to attempt to boost the eurozone out of a deflationary slump, a move that up to this point in the GFC the ECB has refused to make. This combination of a faltering eurozone economy and the risk of ECB money printing has exacerbated the flow out of euros and into US dollars, helping to drive the dollar to it's longest consecutive week rally in history.

Global unrest is continuing to grow, with separatist or democracy movements rising in the UK, Spain, South America, Syria, Hong Kong and other parts of Asia. As well as the ongoing conflicts in Ukraine, the Middle East and of course the battle against the Islamic State. More of these conflicts will flare up and intensify as the global economic situation worsens.

Lastly, the fear is rising as Ebola continues its deadly creep across the globe. This is playing out in a predictable manner with initial apathy replaced by concern, concern replaced by fear, and finally once the horse has bolted, fear replaced by panic. How bad Ebola proves to be only time will tell, but my insticts are telling me it is going to get a whole lot worse before it gets better.

According to the financial media, this toxic brew of bad news was the reason for the current stock market correction. But as we know from previous posts, it is never the news that causes the move, it's the condition of the market. When the market is strong, bad news is constantly shrugged aside and discounted and the market continues to rally, or 'climbs a wall of worry' as it is known. However when the market is exhausted and ready to correct, almost any news will be interpreted as bearish and the market will fall simply because it is time for a correction.

Having reached those new highs in September the US equity markets have fallen over the last few weeks, with volatility increasing and volume growing as sellers start to overwhelm buyers. 

Let's have a look at a chart of the S&P 500 Index to see where support might lie.


 It is clear to see the fall of the last three weeks, and the increasing volume reinforcing the significance of the move (denoted by the three expanding red bars at the bottom of the chart). If we take the arbitrary 10% correction figure from the high of 2019 we get very close to the 1814 level that acted as support back in April. This area should the first real level of support, should this give way, we could see a short, sharp drop down to the 1737 level which would signify a 14% correction from the high. There is of course the 1904 level which is as yet unbreached, however I think the chances of this holding for any length of time are not good.

I have spoken before about Point and Figure charts and their capability to give price forecasts, so let's see if it corroborates the chart above.


We can see that according to this chart when the 1930 support level was broken, a downside count of 1840 was activated, meaning that the index should fall to this level and possibly further. We can also see the blue line of support currently at 1820. At this point I must stress that counts are not always reached but they are a useful tool when it comes to trading or investing.

Whilst I believe we have further to fall, I do not believe this is the major top that we know will come, the pieces are simply not yet in place. This is just an overdue correction before we take off to new highs and as such, it provides a buying opportunity.


Tuesday, 1 July 2014

As Safe as Houses?


AS SAFE AS HOUSES?

The debt fuelled excesses of the early 2000’s drove house prices in many parts of the world to incredible heights. When the bubble burst in 2007/8 it sent prices into retreat, and after a few years with corrections of up to 40%, valuations were (in some parts of the world at least) once again at fair value. Since then prices have generally recovered, as valuations once again rise to normal levels. However this recovery has been quite patchy with some areas recovering normally, some parts of the world soaring to post 2007 highs, and other parts of the world stagnating or falling further.

This recovery from low valuation levels is quite normal and part of the repeating cycle from low to high and back again that we witness in all asset groups. However, this specific nature of the global house price recovery is being driven by the increasing stream of money looking for a safe haven. Due to a combination of political uncertainty, higher taxes and a deteriorating economic outlook, this money, which is flooding out of China, Europe, Russia, the Middle East and Latin America is looking for an asset that is in a safe location and relatively liquid. As a consequence we are seeing high-end property booms in places like New Zealand, Australia, Canada, London and a number of cities in the US.
This phenomenon is causing serious distortions in those property markets, and with the top-end continuing to power away, the market is getting extremely stretched and out of balance in some countries.

Back home here in New Zealand, the effect is particularly acute as Auckland has a disproportionate effect on the NZ property market as a whole. With it being the centre of commerce for the country, the place where most migrants come and settle, and with almost a quarter of the country’s population residing there, what happens in the Auckland property market has implications for the rest of the country. As when house prices take-off, whatever the reason, the Reserve Bank resorts to raising interest rates to try and control it, and often what is right for Auckland is wrong for everybody else.

Despite many arguments in favour of a broad range of measures to combat excessive house price rises, the blunt tool of raising interest rates has been the default setting of reserve banks around the globe for many years. In previous posts I have commented on the need for changes in both the tax treatment of property investors, and changes in the rules for high Loan to Value (LVR) mortgages, as well as treating mortgage risk on the lending banks balance sheet differently. And back in October last year, the Reserve Bank of New Zealand (RBNZ) did finally introduce new restrictions regarding banks ability to lend at levels greater than 80% of the property’s value. This has had the effect of reducing demand amongst first-time buyers in the lower house price bracket where the high LVR’s are more prevalent, however its had absolutely no impact on the top-end, and because of the lack of restrictions on property investors, the potential beneficial effects of this policy change have been mitigated.
Also in New Zealand’s case, these effects are being compounded by the relative lack of new houses built over the last few years, plus the increase in net migration. And so we see the gap between the top and bottom of the property market continue to grow.

However, even if Governments and Reserve banks around the world developed and introduced cohesive policies to prevent excessive house price rises (which is highly unlikely), it still would not eliminate the current problem. These types of rules work fine during ‘normal’ economic periods where relative investment return is the driving factor -  if the return of one investment is reduced by taxation etc, money simply moves to the next best alternative. But when the economic landscape changes, the imperative becomes the return of your money, not the return on your money. This radically changes the mindset of investors and renders many of the normal rules obsolete.

We will likely see this trend continue for some time, with the underperforming cities, regions and countries continuing to lag as money increasingly flows out of these places, whilst the outperformers race ahead as it is redeployed. It is important to understand that this process has got nothing to do with value, in the property hotspots of the world we left value behind long ago. It is purely about the weight of money, and whilst there is enough to levitate prices higher, it will continue.

My guess is that things will start to crack once we see the next global downturn, the second and much more damaging leg of the GFC sometime in 2016. Once it really starts to bite and finally affect the US, its safe haven status will be undermined. At that time, the money that has distilled out into these property hotspots will start to look for the exits. And is when we will see these incredible price gains unwind, brutally, if history is any guide.

If you are a property investor in these hotspots, I would recommend you pick your moment to leave the party very carefully.

If not, then just sit back and enjoy, it should make interesting viewing

Monday, 12 May 2014

Seasonality and the Stock market


Seasonality and the Stock Market

The adage ‘Sell in May and go away, don’t come back till St. Leger day’ is once again starting to resonate around equity markets. Originating in Britain in the early 1800’s the expression started because of the tendency for stock markets to under-perform during this 5 month period, and was a warning to be sitting in cash rather than be invested during this time frame.

 The phenomenon was caused by the mass exodus of investors and senior market participants on their summer vacations, which at that time of course included attendance at the five classic horse race events that occurred throughout the summer (commencing in early May with the 2000 Guineas Stakes, followed by the 1000 Guineas Stakes, the Epsom Oaks, the Epsom Derby and finally in late September the last of the five, the St. Leger Stakes). 

Whilst the expression had been known for centuries, very little statistical work had been done to establish its accuracy until 2002 when analysis from Bouman and Jacobsen showed that the effect had occurred in 36 out of 37 countries examined, and as far back as 1694 in the UK, it truly is a global phenomenon.

However, just because we know it is a factor in stock market performance does not mean it is the only factor. There are many reasons why the under-performing bias at this time of year can be overwhelmed by other, more powerful factors, not the least of which is whether we are operating in a secular bull or bear market. To highlight any differences, the two charts that follow show an averaged performance breakdown of the Dow Jones Index over the calender year, indicating how each month compares. The charts encompass different periods to show how the phenomenon compares during secular bull and bear periods.

The first chart shows the period from 1956 to 1982. The years from 1956 to 1966 were part of a secular bull market and witnessed a sharply rising stock market, whilst the the years from 1966 to 1982 were a secular bear period and caused stock prices to fall dramatically, resulting in the Dow Jones being virtually unchanged over this 26 year period.


Predictably we can see that during this period there is a noticeable fall through this May to September time frame.

 In the next chart we see how the Dow Jones performed during the period from 1983 to 2010, a period of time that saw the greatest secular bull market in history.


More surprisingly, even during this period of rampant stock market gains there is clearly an under performance during the May to September time frame, even continuing into October. Maybe Mark Twain was right after all when he observed that October is one of the most dangerous months to speculate in stocks, although he did add "the others are July, January, September, April, November, May, March, June, December, August and February." 

It appears therefore that regardless of whether the broader market is in bullish or bearish mode, the seasonal bias is still strong enough to register a noticeable underperformance during the May to September period.

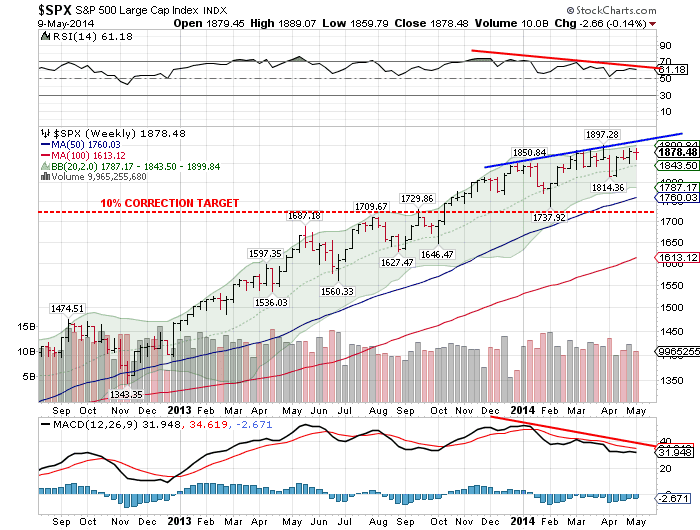
So having established that we may well encounter a head wind for the next five months, are the US equity markets looking healthy enough to weather it? Well if we look at the chart below of the S&P 500  which is a broad based index and therefore a better indicator of the health of the entire stock market, the answer is possibly no.

We can see that whilst the index has been rallying since the turn of the year, the technical indicators on the chart have been falling (see the downward sloping red lines), this is known as a negative divergence and is a sign that the market's rally is losing momentum and that the potential for a correction is increasing. 


Another  worrying factor is the length of time it has been since a major correction occurred. Normally in strong market rallies we should expect the accompanying large corrections (around 10%) to bleed off the excessive speculative fervour and create the energy for the next move higher. However the last time we experienced a major correction was back in late 2011, and we are now well overdue for one (I have drawn a 10% correction target line on the chart above for reference). Buffering that argument is the fact that often as strong rallies reach their conclusion we often get less intense corrections, still, we should expect a correction of sorts even if it doesn't quite fall into the major category.

This potential for a market fall, allied to the time of year means we should be alert to the possibility of a reasonable sell down in equities over the next couple of months.

Should a healthy correction occur it will provide a great buying opportunity to get in for the final blow-off rally still to come as money flows into the safe haven US dollar and chases yield in the US stock market, propelling the indicies to new highs.

It may be time to go 'off to the races', but don't take too long a vacation.


Sunday, 6 April 2014

Deja Vu for the Precious Metals


Deja Vu for the Precious Metals

The precious metals sector has been through quite a rollercoaster ride since we last talked about it back in May of last year. At the time of that post http://kiwiblackers.blogspot.co.nz/2013/05/a-dead-cat-bounce.html , gold had crashed through important support levels around $1530 and plunged as low as $1321 before staging a weak rally. The question at that time was whether or not gold had bottomed and would continue to rally or would the bounce soon peter out to be followed by more weakness. In that post I clearly outlined the reasons why I felt that the rally was a 'dead cat bounce' and that gold and silver still had a long way to fall before reaching a true bottom, I also mentioned a price projection in gold showing a downside target of $1070.

Subsequently both the metals resumed their descent, reaching new lows in July last year of $1179 in gold and $18.17 in silver, after which they again rallied before falling to test these levels of support once again in December. At this point the support levels held, forming a 'double bottom' chart pattern, reinforcing that level of support and allowing the metals to once again stage a rally. 

We can see this double bottom illustrated in the chart below.


 In this chart we can also see the rally that carried prices up to a high of $1392 in gold before topping out and suffering a sharp correction over the last couple of weeks.

So here we are again with the metals at a point of indecision-  Will they recover, resume their rally and finally end the correction that has been ongoing since mid 2011, or will they once again crash through these support levels and carry on to new lows?

To find the answers lets take another look at some of the factors that influenced our decision the last time around, our answers then and how it currently looks.

  • At a genuine low we should expect the rebound to be strong with good volume as buyers return to the market and chase the price higher. Whilst this could still occur, thus far the recovery off the lows has been relatively weak with low volume. 
This time around the volume was once again unremarkable, and certainly not the surge in volume that would suggest a sustainable rally.
  • As was discussed in 'Gold Revisited' the move through the long-term support level in gold has triggered a downside price objective of $1070 and whilst this might not eventuate, it is far from a positive development.  
This downside target still exists and has not been altered by the bounce from the double bottom, in fact it would need a rally up to around $1800 to invalidate the signal. Although we must remember that these targets are not always reached, it is still a bearish sign.
  • On a price move as violent as we witnessed I would have expected the 'commercials' to have aggressively covered their short positions, but the latest COT data below shows that although they have bought back some of their 'shorts' it has hardly been dramatic, suggesting to me that they expect another bite at that cherry.  
 Lets look at the current Gold COT picture below.


You will recall that the red bars signify the net long/short position of the commercials, who for want of a better description we can think of as the professionals, the people that know what they are doing. We can see that the commercials did reduce their short positions substantially, reaching there lowest in July and December, the two periods during which the double bottom occurred, what a coincidence! However, since those December lows their short positions have expanded rapidly, and recently reached there biggest levels in almost a year. This does not paint a pretty picture for the bulls.


If we look at the Silver COT chart for confirmation, the situation is even more pronounced.


  • Lastly, we are entering the weakest period of the year for precious metals. Traditionally gold prices enjoy three bullish periods within the calender year driven by demand for physical gold, the first of which is the buying induced by the Chinese New Year celebrations around January/February. The second period is around August/September when Asian farmers harvest their crops and invest the profits into physical gold, and lastly the Indian marriage season that lasts from September through to November which creates the biggest demand spike of all, as gold is a hugely important part of most Indian wedding ceremonies in its form as a dowry. This May to July timeframe is absent of any drivers of physical demand so we often witness weakness in the precious metals during this period.

This seasonal affect still holds true although it can be over-ridden to an extent by other more powerful factors in some years, but absent of something abnormal we should expect the precious metals to under-perform through this May to July timeframe.

All of these factors seem to point towards further weakness in the precious metals, however we should also expect this bearish outlook to be mirrored in the  outlook for the share prices of companies in the sector. A good proxy for the sector is the Market Vectors Gold Mining Index or GDX, so let's have a look at a point and figure chart to see if it gives us a target price.


 This seems to confirm the bearish outlook and gives us a downside target of $19.62, almost a 20% drop from current levels.

When we combine these factors it looks increasingly unlikely that we have seen a sustainable bottom in the precious metals, and as a consequence I still expect that $1170 price target in gold to be reached in due course. 

When and if it is, expect it to be accompanied by a chorus of calls declaring the end of gold and silver as an investment, experts suggesting the next stop is $600 in gold, and investors throwing in the towel swearing they will never touch the shares or metals again. This will be the anecdotal evidence we need to tell us the end of the correction is finally here, and the beginning of the rally that will take the precious metals back to their old highs and beyond has arrived.