
Seasonality and the Stock Market
The adage
‘Sell in May and go away, don’t come back till St.
Leger day’ is once again starting to resonate around equity markets.
Originating in Britain
in the early 1800’s the expression started because of the tendency for stock
markets to under-perform during this 5 month period, and was a warning to be sitting
in cash rather than be invested during this time frame.
The phenomenon was caused
by the mass exodus of investors and senior market participants on their summer
vacations, which at that time of course included attendance at the five classic
horse race events that occurred throughout the summer (commencing in early May
with the 2000 Guineas Stakes, followed by the 1000 Guineas Stakes, the Epsom
Oaks, the Epsom Derby and finally in late September the last of the five, the
St. Leger Stakes).
Whilst
the expression had been known for centuries, very little statistical work had
been done to establish its accuracy until 2002 when analysis from Bouman and
Jacobsen showed that the effect had occurred in 36 out of 37 countries examined,
and as far back as 1694 in the UK, it truly is a global phenomenon.
However, just because we know it is a factor in stock market performance does not mean it is the only factor. There are many reasons why the under-performing bias at this time of year can be overwhelmed by other, more powerful factors, not the least of which is whether we are operating in a secular bull or bear market. To highlight any differences, the two charts that follow show an averaged performance breakdown of the Dow Jones Index over the calender year, indicating how each month compares. The charts encompass different periods to show how the phenomenon compares during secular bull and bear periods.
The first chart shows the period from 1956 to 1982. The years from 1956 to 1966 were part of a secular bull market and witnessed a sharply rising stock market, whilst the the years from 1966 to 1982 were a secular bear period and caused stock prices to fall dramatically, resulting in the Dow Jones being virtually unchanged over this 26 year period.

Predictably we can see that during this period there is a noticeable fall through this May to September time frame.
In the next chart we see how the Dow Jones performed during the period from 1983 to 2010, a period of time that saw the greatest secular bull market in history.

More surprisingly, even during this period of rampant stock market gains there is clearly an under performance during the May to September time frame, even continuing into October. Maybe Mark Twain was right after all when he observed that October is one of the most dangerous months to speculate in stocks, although he did add "the others are July, January, September, April, November, May, March, June, December, August and February."
It appears therefore that regardless of whether the broader market is in bullish or bearish mode, the seasonal bias is still strong enough to register a noticeable underperformance during the May to September period.
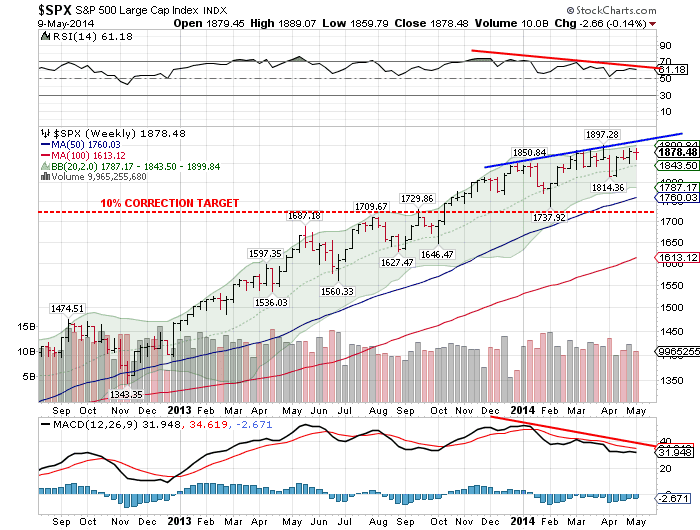
So having established that we may well encounter a head wind for the next five months, are the US equity markets looking healthy enough to weather it? Well if we look at the chart below of the S&P 500 which is a broad based index and therefore a better indicator of the health of the entire stock market, the answer is possibly no.
We can see that whilst the index has been rallying since the turn of the year, the technical indicators on the chart have been falling (see the downward sloping red lines), this is known as a negative divergence and is a sign that the market's rally is losing momentum and that the potential for a correction is increasing.
Another
worrying factor is the length of time it has been since a major
correction occurred. Normally in strong market rallies we should expect
the accompanying large corrections (around 10%) to bleed off the excessive speculative
fervour and create the energy for the next move higher. However the last
time we experienced a major correction was back in late 2011, and we
are now well overdue for one (I have drawn a 10% correction target line on the chart above for reference). Buffering that argument is the fact that often as strong rallies reach their conclusion we often get less intense corrections, still, we should expect a correction of sorts even if it doesn't quite fall into the major category.
This potential for a market fall, allied to the time of year means we should be alert to the possibility of a reasonable sell down in equities over the next couple of months.
Should a healthy correction occur it will provide a great buying opportunity to get in for the final blow-off rally still to come as money flows into the safe haven US dollar and chases yield in the US stock market, propelling the indicies to new highs.
It may be time to go 'off to the races', but don't take too long a vacation.